Quick Links
If you like to keep an eye on CPU or GPU usage on your Mac, you can enable several little-known performance windows in Activity Monitor. These float above all other application windows, so you can check them at a glance.
To enable these, press Command+Space or click the Magnifying Glass icon in the menu bar to open Spotlight search. Type "Activity Monitor," and then press Enter.

Click "Window" at the top. In this menu, you'll see choices for "CPU Usage," "CPU History," and "GPU History." Each of these opens a floating window that will give you real-time information.

Let's take a look at how each of these panels work.
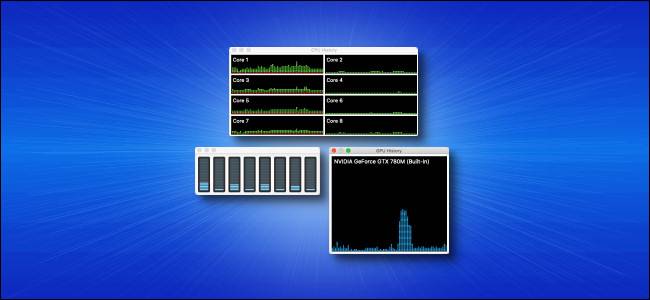
The Floating CPU Usage Panel
If you click "CPU Usage" in the "Window" menu (or press Command+2), a small window appears that includes a 10-segment gauge for each core in the CPU.
Each gauge lights up depending on how much CPU activity is taking place in that particular core. For example, if five segments are lit, you're using 50 percent of that core's CPU capacity.

The Floating CPU History Panel
If you click "CPU History" in the "Window" menu (or press Command+3), a window divided into multiple boxes appears. Each box corresponds to a core inside the CPU and displays updates slowly, from right to left.
The height of the dots in each column corresponds to the intensity of CPU activity in that core. The red squares represent CPU activity by system processes, while the green represent CPU activity by user processes.

The Floating GPU History Panel
If you select "GPU History" in the "Window" menu (or press Command+4), you'll see a graph depicting the history of Graphics Processor Unit (GPU) utilization on your Mac. The more active your GPU, the more blue dots that appear during each update, as the graph flows from right to left.
As to what exactly the blue squares in the graph represent, we aren't certain (even Apple's official documentation isn't clear about this). However, the graph does provide a rough visual estimate of how hard the graphics hardware is working.

Changing the Performance Window Update Interval
By default, each performance panel updates every five seconds. If you'd like to change that, click View > Update Frequency in the menu bar. In the submenu, you can choose either "Very Often (1 sec)," "Often (2 sec)," or "Normally (5 sec)."

Note that on older systems, setting the graphs to update more frequently might slightly decrease overall system performance. On most modern Macs, though, the effect will be negligible.
Setting a Performance Window to Remain Visible
If you want to keep one or more of the CPU or GPU performance panels on-screen, you can make them float above all the other windows. To do so, click Window > Keep CPU Windows on Top in the menu bar.

If you don't want to see the main "Activity Monitor" window, simply click the red "X" to close it. If you want to open it again later, just click Window > Activity Monitor in the menu bar or press Command+1.

There's a lot more to Activity Monitor than most people realize. If you dig deeper into its features, you can learn a lot more about how your Mac works. For example, you can even use the Activity Monitor Dock icon as a CPU monitor!